
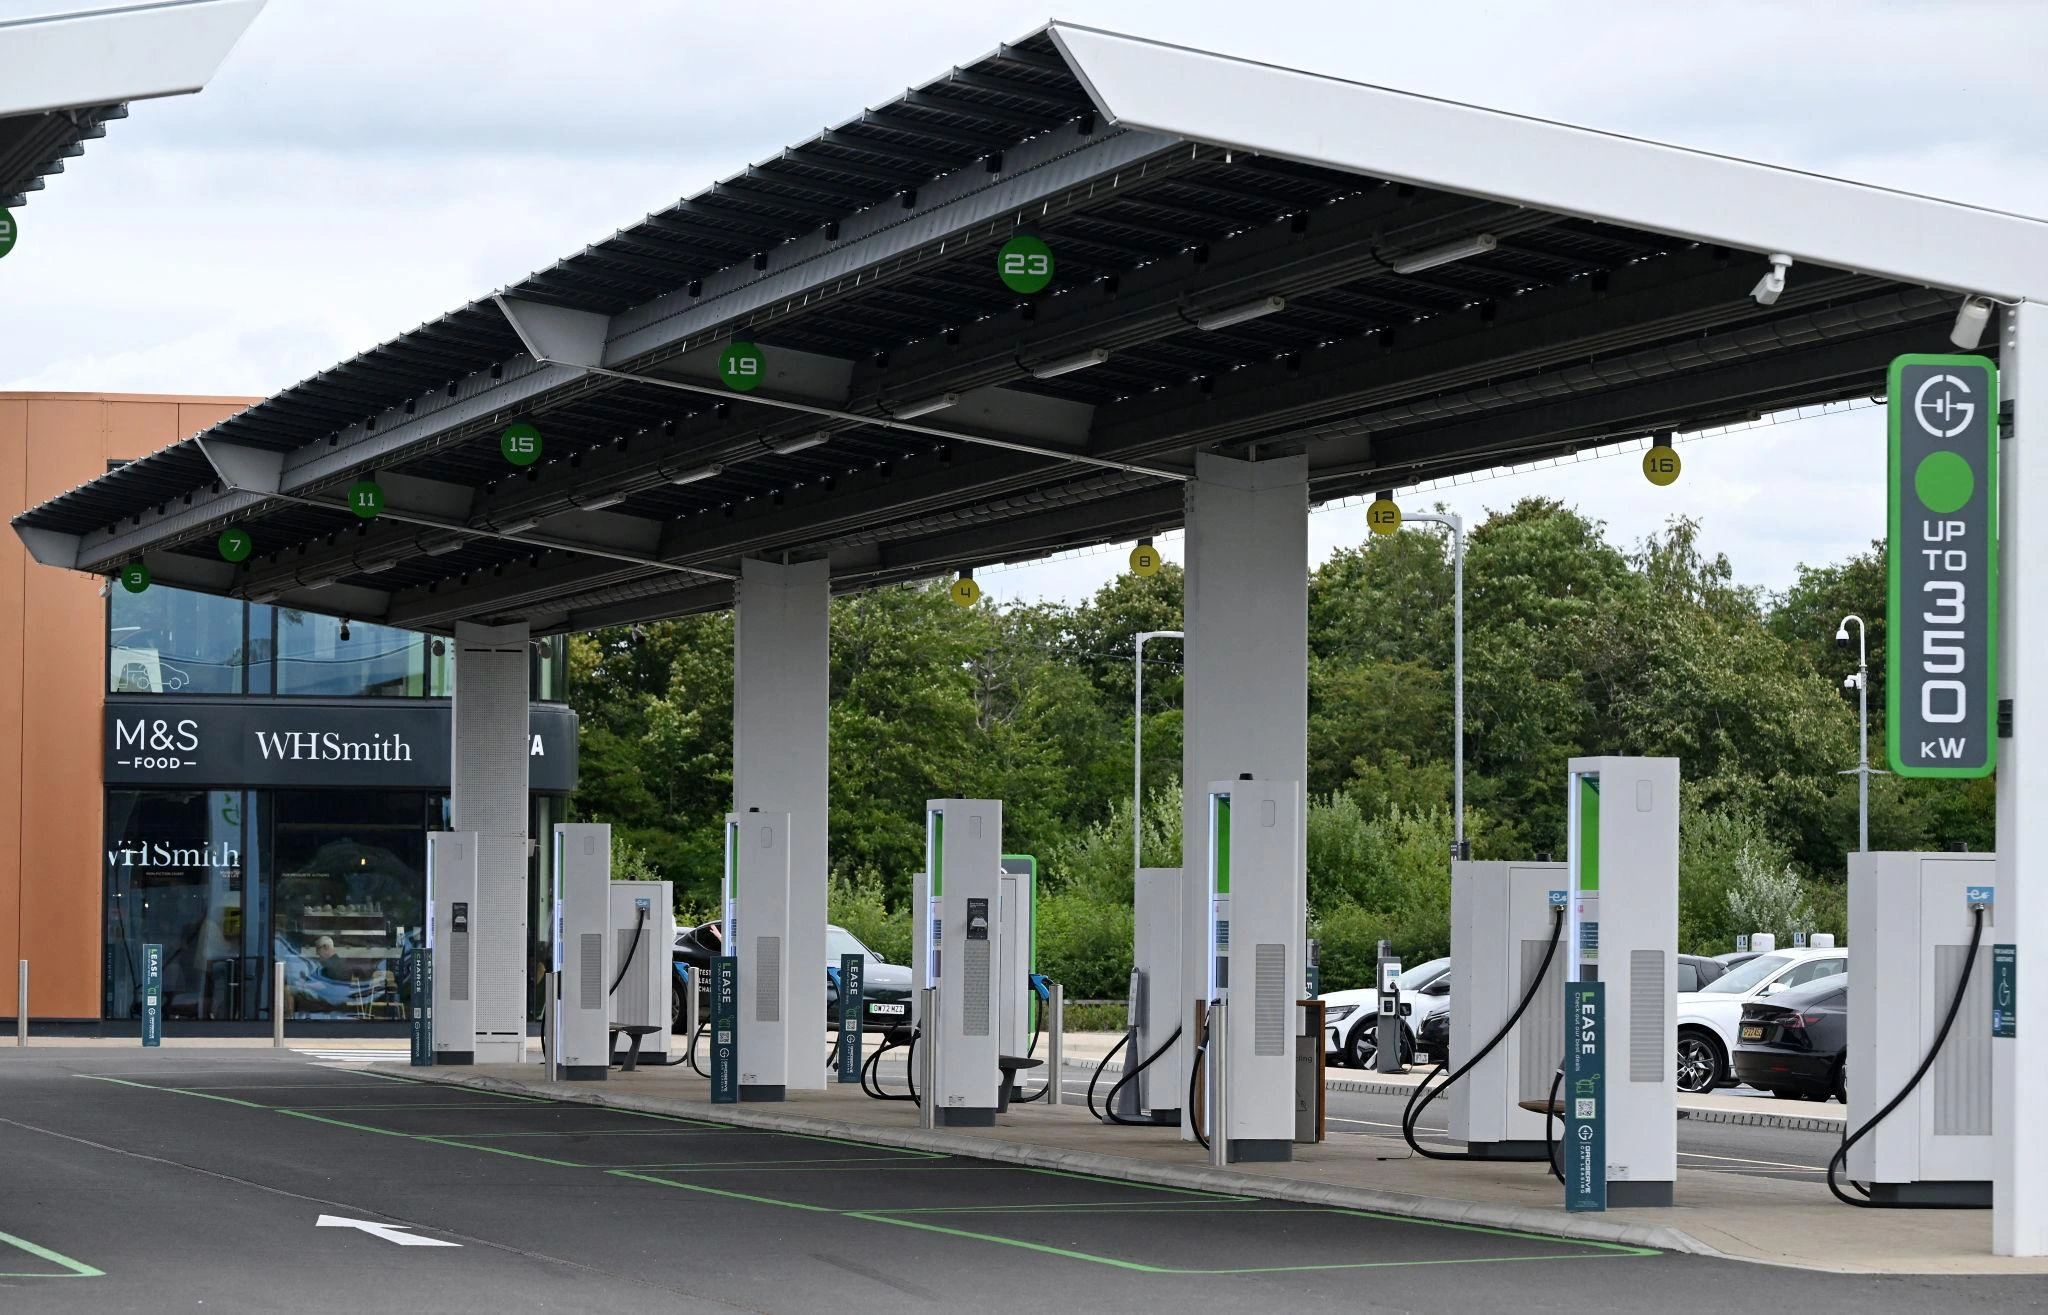
The Metric No One Talks About
While range dominates headlines, the real battleground in the EV market is shifting toward a far less visible metric, charging curve performance. This single factor is rapidly becoming the defining element of real-world usability.
Consumers are not experiencing EVs through peak specifications, they are experiencing them through time, specifically how long they spend waiting to charge.
250kW
Short burst only
10–80%
Critical window
Time
Minutes, not kW
Peak Numbers vs Real Performance
Charging speed is often marketed as a headline number, 150kW, 200kW, or even 250kW. In reality, these peak values are rarely maintained for more than a short period. The majority of the charging session occurs below this level.
A vehicle that sustains high charging speeds consistently across the 10 to 80 percent window will outperform competitors in real-world use, even if its peak figure is lower.
Why This Matters in the UK
In the UK and wider European market, where long motorway journeys and reliance on public charging are common, this difference becomes highly visible. Drivers are not measuring charging speed, they are measuring total journey time.
Vehicles with poor charging curves introduce friction into long-distance travel, while those with stable curves create a seamless ownership experience.
The competitive advantage in EVs is shifting from battery size to charging consistency. Vehicles that minimise downtime will outperform those that maximise headline specifications.
The Role of Thermal Management
Thermal management systems are a critical driver of charging curve performance. Advanced cooling and battery preconditioning allow vehicles to sustain higher charging speeds for longer periods.
This directly reduces charging time, improves efficiency, and increases user confidence in real-world scenarios.
Strategic Implications
For manufacturers entering Europe, charging performance is no longer a secondary metric. It is a core competitive differentiator. Consumers may not yet understand charging curves, but they will quickly recognise which vehicles reduce downtime.
In the next phase of EV adoption, the fastest vehicle will not be the one with the highest peak charging speed, but the one that gets drivers back on the road the quickest.